The point of tracking health and wellness over time is to see trends toward continued or improved wellness. Many of the metrics tracked by popular fitness trackers take time to see trends. Small daily goals, like the often touted 10,000 steps, are good for keeping habits but it’s important to build long term habits. That is why looking at full 12 month trends can be so insightful.
Find out more about Apple Watch with our article The Complete Guide to Understanding the Quantified Self.
For people using Apple products the Health app produces plenty of charts that can be viewed on a year time scale. Other apps, like the Health mate app, also produces annual reviews and training apps like Strava make it easy to see year to date total training amounts.
The best part of having a watch or fitness tracker take daily readings is that you can check out long term trends. Especially for less responsive metrics this is fun to look at over the course of a year.
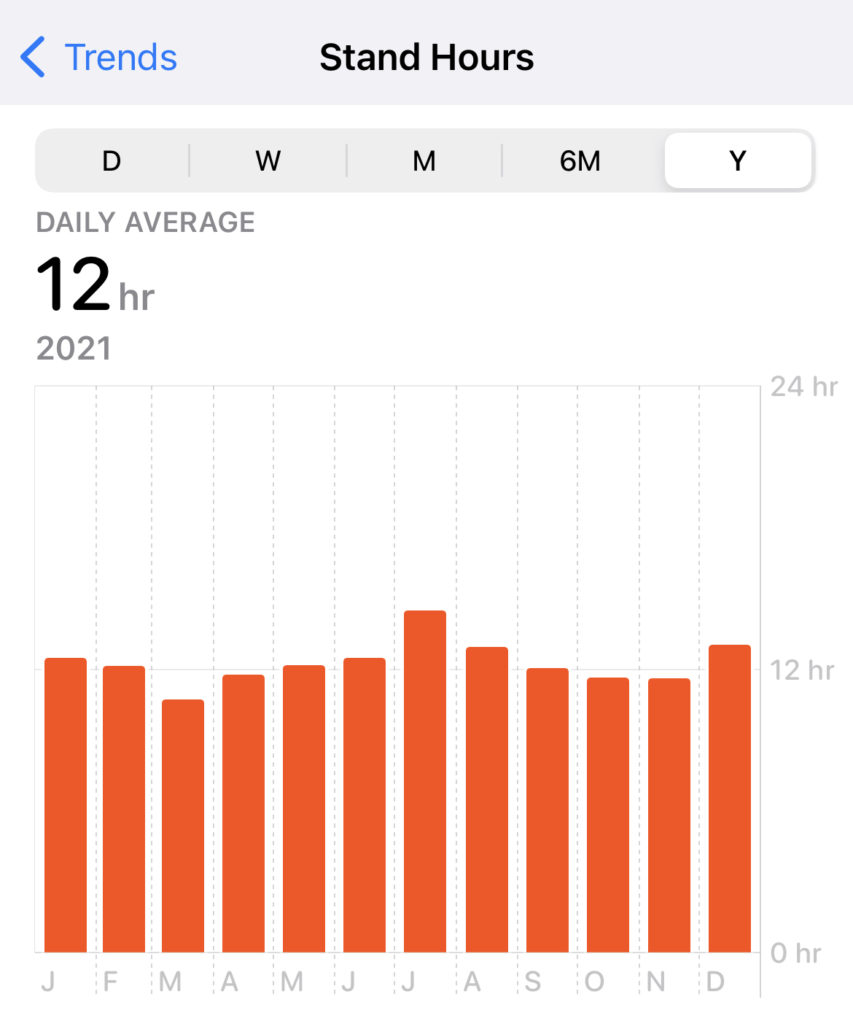
Stand hours on the Apple Watch are funny. Sometimes and alert will ping and a notification that the stand ring is closed will pop up while laying in bed. Even with inaccuracies, overall the prompt can help avoid sitting for too long daily. Over the course of the year averages only varied by 1-2 hours, and we’re correlated to times of either being injured from daily walk/run training efforts or for months with more vacations (and hence less days working in a chair in front of a computer for 7-9 hours).
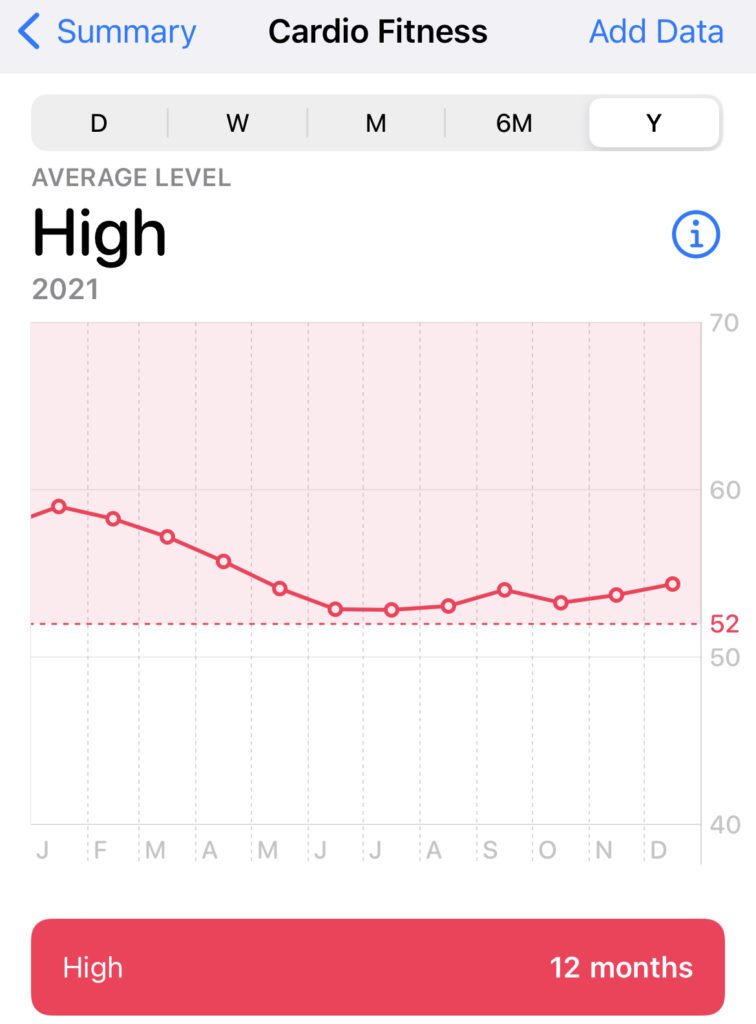
One Year Change in VO2 Max
VO2 max is another hard to shift metric. Changing it requires a shift in total cardio work, or adding or losing a significant amount of weight. The beginning part of the year, again associated with an injury and related weight gain, saw this value drop. It steadied out over the summer as the running training load stayed constant. Thankfully, late in the year with the purchase of Peloton and the weekly addition of a few hours of cycling, VO2 max started creeping back up.
The Apple reading for VO2 max is limited to 14-60ml/kg/min. This means early in the year the trend was at the limit of what the watch would measure. Still, this is pretty close to a lab reading we tried out early in the year where sub-maximal Apple Watch VO2 max reading was similar to a dexaFit VO2 max treadmill test.
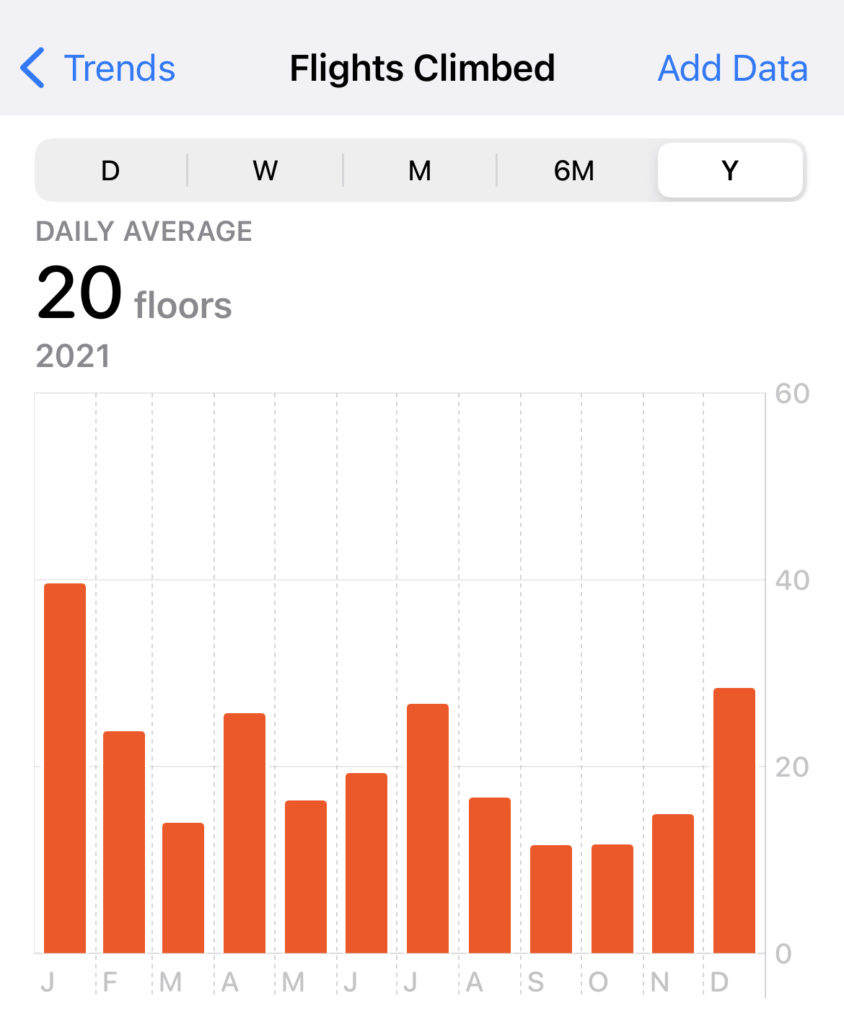
Annual Flights of Stairs Climbed
Next up is flights climbed. This is a great metric to keep track of alongside steps and stand hours to check the intensity of daily habits.
The easiest way to shift this number is taking up hiking, hill running, or straight stair climbing as a workout. For anyone living a few floors up, or who works in a place where they climb stairs this will be higher. However, live in a ranch style home and work from home in a non hilly area and this number will be lower.
It is possible to see how many vertical feet you have covered during a workout with the Apple Watch. This uses GPS, but typical stair counts also use the accelerometer to estimate stairs climbed. Other tracking apps, like the one we like to cover (Strava), also show elevation gained as a metric which is comparable to stairs climbed.
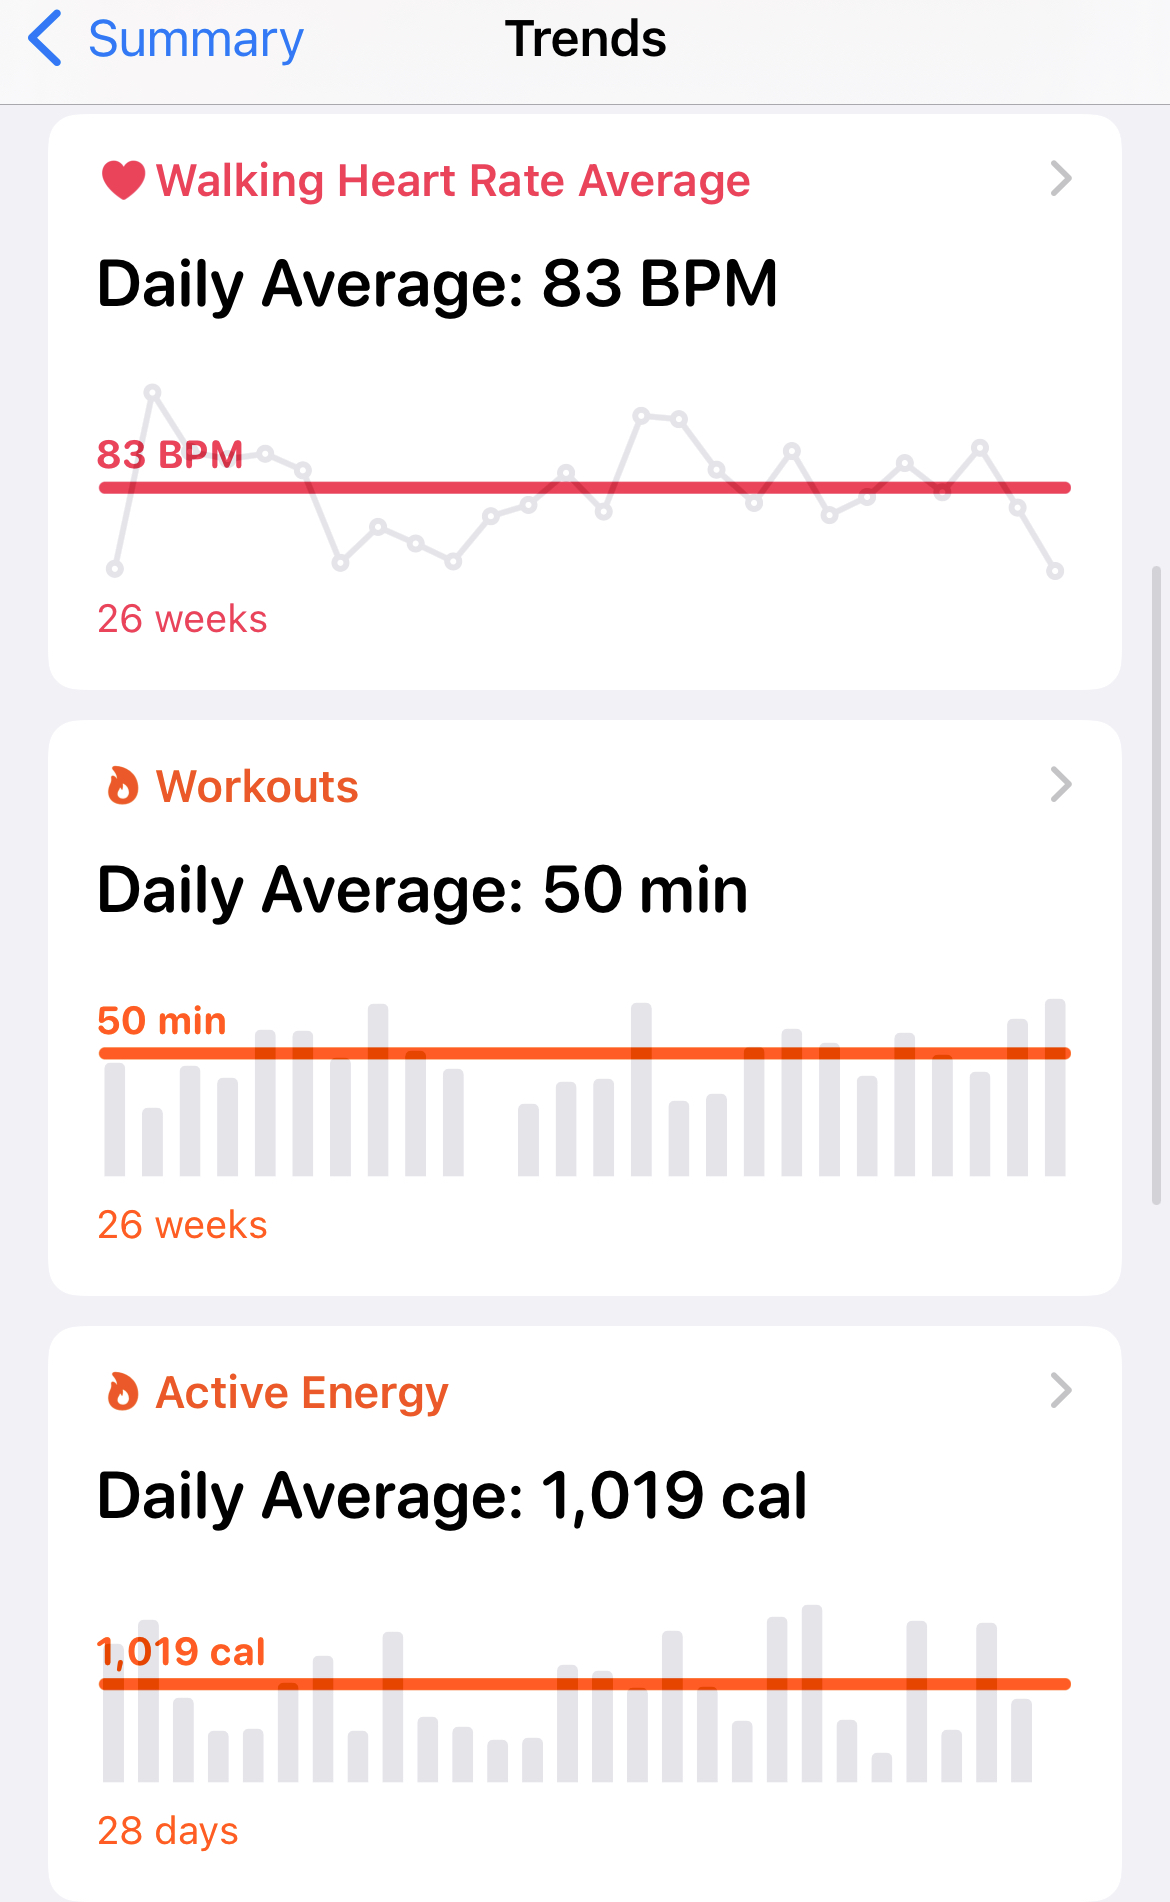
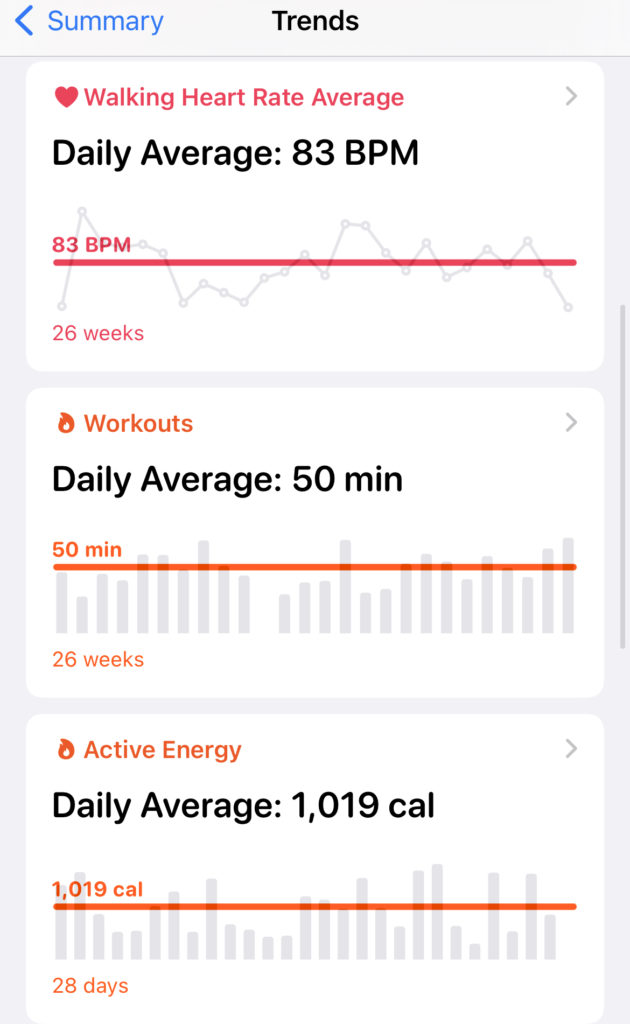
Workout Minutes Annual Averages – Closing the exercise ring!
Finally we get to the aggregate workout totals that really show progress. Total minutes spent workout out, and average daily minutes, as well as calories burned, are a great measure for long term training plans.
Going for a half marathon, marathon, triathlon, or long endurance event training plan and want to see progress? Just start looking at average daily time spent working out.
This is a great metric because it can be broken into a simple daily goal, but also must be balanced in total. Sure you can have a day where you workout for 5 hours and burn 4000 calories, but that is not a typical day. To get a trend up in average daily workout minutes, consistent habits are required.
The other reason this Metrics are popular is because of their access using an Apple Watch.
For the Apple Health app the daily averages are buried in some of the secondary dashboard screens. But on the Apple Watch there are daily rings.
The three rings each independently monitor Daily Stand Hours, Daily Exercise Minutes, and Daily Calories burned (active calories, as compared to baseline calories burned just from breathing, etc).
Each of the rings can be associated with a personal goal, for example 30 minutes of exercise. While the Watch app lets you see how many rings were closed in a day, the long term visual is much easier to see in the Apple Health app line charts.