We cover Strava here a lot. It is one of the best ways to gain insights into fitness data, and share it with friends. With any social service and especially those that are data oriented, the core product is designed for the masses. To get even more out of your data it is possible to use one of the popular Strava add ons, including the one reviewed here, Sauce for Strava.
Sauce For Strava is a Chrome browser extension, so to get use out of it you are going to need to be on a desktop and not the mobile app. It is a free application, although for a small Patreon donation you can gain access to additional features. The free version however is plenty to be able to get more out of your data. By default Sauce brings tons more data directly onto the activity page. Most obvious of this data extension is the inclusion of deeper data about the intensity and average times of the activity. This is placed directly into the activity data (note in the picture below “Elevate” stats require a click to get into, Elevate is a separate add-on).
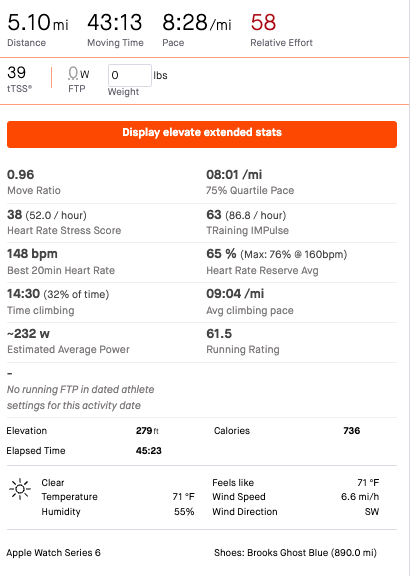
Sauce For Strava and Extended Stats and Features
In addition to the added stats, Sauce brings all of your comments directly into the activity page. In general this is the theme of Sauce, to make sure that all the data is available in one place so you do not have to go diving into different areas to get more features. Although Sauce for Strava does not have a way to compare workouts against one another, it is possible to open multiple browser tabs and do the comparison yourself.
The other useful comparison feature is the ability to export the data that makes up their graphs. They highlight how to do this in their walkthrough videos. All of the data is underlying in the activity but parsing it out from the raw gpx track would be prohibitively difficult. You are able to clip sections and see your performance, which can be particularly useful if you really want to dive into the performance of a key segment of race.
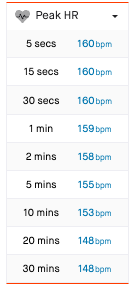
The other area where Sauce adds stats is in the side bar. One of the more accessible ones is a Peak HR output. There are peak pace and peak power as well. Peak HR is particularly useful as it does a better job of breaking down how long your were in various HR zones at one time. This is a useful way to normalize data outliers, for example when a faulty watch suddenly reports a 220bpm HR for 2-3 seconds, it will not show up in the averages the same way. You can get similar data by eyeballing a HR chart, but this readable output is much preferred.
The Fun Part of Sauce for Strava
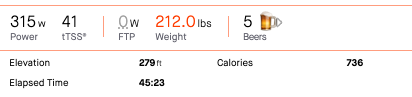
Sometimes there are features that are there for more of a fun overlay. Sauce does this by incorporating comments data directly into the activity, which makes the Strava desktop platform much more of a social thing. The other cute feature they have is a simple calories calculator that will tell you how many beers you burn during a workout. To get an output you need to ensure that you have your proper weight input, this is needed as it would appear on the backend Sauce takes into consideration the baseline calories that your body burns during the time of the activity. Similar to many watches, notably the Apple Watch, the calories burned projected seems to be just the active calories burned and not comprehensive of baseline calories.
If you are not someone who drinks beer, then you can cycle through a number of other popular foods including pizza slices, pancakes, nigiri sushi and more. For many this is a better real life measure of a workout intensity than things like Strava Fitness score or FTP output. On a day-to-day basis many of us have unstructured workouts, those that do not have a primary goal in mind other than to arbitrarily “stay fit” and this calculator at least translates that into other real world activities.